Yet another sushi restaurant, web scraping thuisbezorgd and reporting in Power BI.
Last week I noticed that yet another sushi restaurant opened for business in my area. After going through the Thuisbezorgd page of my postal code I noticed that I can order sushi at 11 different restaurants. For a city the size of Gouda, with around 70.000 inhabitants, this looks like a lot of competition. This left me wondering:
Do places exist where no sushi is available through Thuisbezorgd?
Where can one find the highest number of sushi restaurants?
Do we actually enjoy the sushi we order?
This is exactly the type of side project I enjoy working on. It will require gathering data from Thuisbezorgd .nl, converting thousands of HTML pages into a usable (semi-)structured data source and finally I can play around with the data in Power BI.
Let’s start with the results first and do the more technical part later.
Results
Q1: Do places exist where no sushi is available through Thuisbezorgd?
Yes, these places exist. The green/blue colored areas do not have any delivery options for sushi. All municipality’s except for Schiermonnikoog (island in the north) have at least one restaurant on Thuisbezorgd. So all other green/blue colored areas do have restaurants on Thuisbezorgd, but no sushi delivery. If you are looking to open your own sushi shop on Thuisbezorgd you should definitely consider Zaltbommel, a city with almost 12.000 inhabitants that has no home delivery competition for sushi on Thuisbezorgd. Other areas without sushi are located around the German border and the sparsely populated provinces Zeeland and Friesland.

Data for sudwest-fryslan is missing, the esri mapvisual kept mapping it to The Hague for some reason when not using exact match modus… Still need to find which value will be mapped correctly.
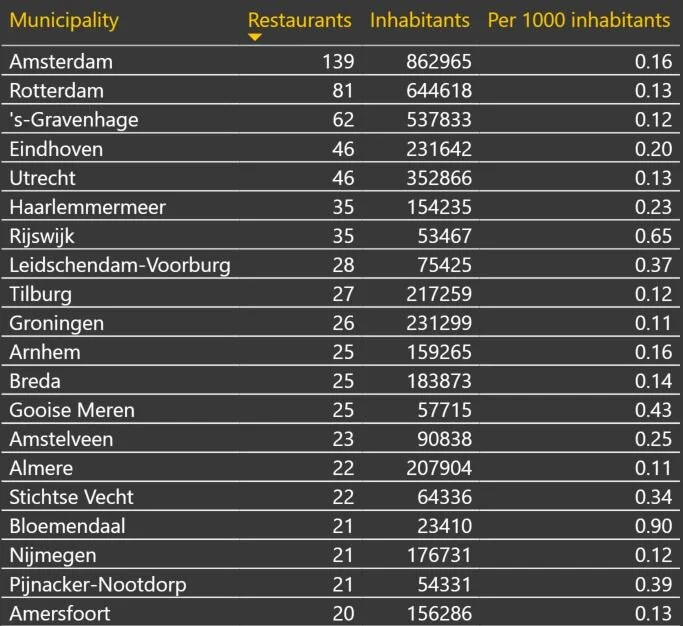
Q2: Where can one find the highest number of sushi restaurants?
Amsterdam it is, to be more specific: 1054 postal code. When ordering sushi from the 1054 postal code area (around overtoom/vondel park) you have a whopping 75 restaurants that deliver sushi to choose from. That is a lot, if you order sushi once a week it will take you over 1,5 years to order from every restaurant. After those 1,5 years a couple of new spots will emerge and you can start all over again.

When grouping the data at the municipality level we can see the bigger cities from the randstad area in the top 10. But also the large cities from the south like Eindhoven and Tilburg. Also a lot of smaller municipalities that are located next to a large city show up. The data is based on delivery options in postal codes and not on the actual physical location of the restaurants. A restaurant located in ‘s-Gravenhage delivering to both ‘s-Gravenhage and Rijswijk increases the restaurant count in Rijswijk as well and can therefore be double counted.
Q3: Do we actually enjoy the sushi we order?
The review data says YES, sushi is the type of food people enjoy. On average a sushi restaurant is rated 4.13, this is within the top 5.
Based on the overview with average ratings per kitchen or food type one can also assume that some foods are more suitable for delivery than others. If food is more suitable for delivery it definitely will help with the customer experience. Food that is more sensitive to temperature change and time going by gets worse ratings. For example restaurants that serve food type “patat” have an average rating below 4. Items like Italian pizza, burgers and American food also get poor ratings. I filtered on the top 25 food types based on the count of restaurants serving them to exclude categories that only have a few restaurants. If I include more kitchens/food types items like indian food and curry appear at the top of the list as well.

Ratings for 25 most popular categories by restaurant count
Data collection
Right from the start I knew data collection will be a challenge. The first step is finding out how the Thuisbezorgd website is structured. When you type in an address in Thuisbezorgd it takes you to a page with restaurants that deliver to your area. When you search for restaurants that deliver to address “Dam 1 Amsterdam“ it will take you to the page with restaurants for amsterdam-1012, the number represents the first 4 digits of the postal code belonging to the address.
My plan:
Get a list of all the postal codes in the Netherlands
Download the HTML page from Thuisbezorgd for every postal code on the list
Convert all the individual pages into a single JSON file
Load JSON file into Power BI and create a usable data model
Get answers to our questions
Scraping Thuisbezorgd.nl
Finding a list of all postal codes is easy. CBS publishes a lot of data through their portals, this ODataFeed is perfect for our use case. I created a python function that extracts all postal codes, gets the first 4 digits and returns them all in a list. This list of postal codes is input for the actual web scraper. I am not going to cover this in detail, but the flow of the web scraper (using Selenium) is simple:
First go to Thuisbezorgd .nl
Type in the postal code using the .sendkeys() method and hit the enter key to trigger the search.
Wait for 6 seconds to make sure that the entire page is rendered correctly.
Save the page source in a folder structure that looks like this: results/{postal_code}.html.
Go back to Thuisbezorgd.nl and repeat for the next postal code
Thuisbezorgd is not using any form of pagination for their results, this makes the web scraping job easy to write as it is one obstacle less to deal with. I choose to store the raw individual pages first instead of extracting the information I need on the fly and storing it as JSON directly. This allows me to extract data elements later on if I need more information, as I can just re-run the process that converts HTML files to JSON instead of visiting all the 4000 pages again. The web scraper ran for almost 7 hours (4000 pages * 6 seconds waiting time is about 24.000 seconds, also known as 6,7 hours). Imagine forgetting to extract a required attribute and therefore having to re-run the entire 7 hour process. Let’s not do that.
Converting 4000+ HTML files to JSON
The simple web scraper using Selenium produced over 4000 HTML files. For each 4 digit postal code a HTML file is created containing the entire page for the search result. Below is a HTML snippet of a restaurant element on the Thuisbezorgd website. From this snippet we extract the information needed for the analysis.
For each restaurant we extract:
name
kitchens
data_url
restaurant_id
restaurant_data_id
worst_rating
rating_value
best_rating
review_count
delivery_cost
average_delivery_time
<div class="restaurant js-restaurant" id="irestaurantQ50Q7OO" data-id="Q50Q7OO" itemscope="" itemtype="http://schema.org/Restaurant" data-url="/menu/hap-hum">
  <div class="logowrapper">
    <div class="baloon-container restaurantlabel"></div>
    <div class="logo-n">
      <a href="/menu/hap-hum" class="img-link">
        <img
          class="restlogo lazy-loaded"
          src="//static.thuisbezorgd.nl/images/restaurants/nl/Q50Q7OO/logo_465x320.png"
          data-src="//static.thuisbezorgd.nl/images/restaurants/nl/Q50Q7OO/logo_465x320.png"
          alt="Eethuis Hap-Hum - Voor een heerlijke maaltijd"
          data-was-processed="true"
        />
      </a>
    </div>
    <div class="review-rating">
      <div class="review-stars notranslate">
        <span style="width: 90%;" class="review-stars-range"> </span>
      </div>
      <span class="rating-total">(799)</span>
      <span class="rating-total-short">(799)</span>
    </div>
  </div>
  <div class="detailswrapper">
    <h2 class="restaurantname">
      <a class="restaurantname notranslate" href="/menu/hap-hum" itemprop="name">Eethuis Hap-Hum</a>
    </h2>
    <div itemprop="review" itemscope="" itemtype="http://schema.org/Review">
      <meta itemprop="name" content="Eethuis Hap-Hum" />
      <span itemprop="reviewRating" itemscope="" itemtype="http://schema.org/Rating">
        <meta itemprop="worstRating" content="1" />
        <meta itemprop="ratingValue" content="4" />
        <meta itemprop="bestRating" content="5" />
        <meta itemprop="reviewCount" content="799" />
      </span>
    </div>
    <div class="kitchens">
      <span>Spareribs, Snacks, Italiaanse pizza</span>
    </div>
    <div class="bottomwrapper details">
      <div class="delivery js-delivery-container">
        <div class="avgdeliverytime avgdeliverytimefull open closed">Gesloten voor bezorging</div>
        <div class="avgdeliverytime avgdeliverytimeabbr openAbbr closed">Gesloten voor bezorging</div>
      </div>
    </div>
  </div>
</div>
To extract the data a library called BeautifulSoup is used. This library enables you to pull data out of a HTML or XML file. The snippet of HTML above will be processed by the extract_restaurant_data function. A page contains 0 or more restaurants. The extract_html_file reads the file and creates a BeautifulSoup object. Then using the findAll function all restaurants are extracted from the HTML source. For each restaurant it will then execute the extract_restaurant_data. This function returns a dictionary containing all the data elements that we are interested in.
def extract_restaurant_data(restaurant, file_name):
    restaurant_data = {
        "name": restaurant.find(itemprop='name').string if restaurant.find(itemprop='name') else None,
        "kitchens": restaurant.find('div', {'class':'kitchens'}).span.string.split(',') if restaurant.find('div', {'class':'kitchens'}) else None,
        "data_url": restaurant.get('data-url',None),
        "restaurant_id": restaurant.get('id', None),
        "restaurant_data_id": restaurant.get('data-id',None),
        "worst_rating": restaurant.find(itemprop="worstRating").get('content', None) if restaurant.find(itemprop="worstRating") else None,
        "rating_value": restaurant.find(itemprop="ratingValue").get('content', None) if restaurant.find(itemprop="ratingValue") else None,
        "best_rating": restaurant.find(itemprop="bestRating").get('content', None) if restaurant.find(itemprop="bestRating") else None,
        "review_count": restaurant.find(itemprop="reviewCount").get('content', None) if restaurant.find(itemprop="reviewCount") else None,
        "delivery_cost": restaurant.find('div',{'class':'delivery-cost'}).string if restaurant.find('div',{'class':'delivery-cost'}) else None,
        "average_delivery_time": restaurant.find('div',{'class':'avgdeliverytime'}).string if restaurant.find('div',{'class':'avgdeliverytime'}) else None,
        "is_chain": (True if "chains" in restaurant.find('img', {"class": "restlogo"})['data-src'] else False) if restaurant.find('img', {"class": "restlogo"}) else None,
        "source": file_name
    }
    return restaurant_data

def extract_html_file(file_name):
    output = []
    with open(file_name, encoding='utf-8') as f:
        content = f.read()
    bs = BeautifulSoup(content, "lxml")
    restaurants = bs.findAll('div', {'itemtype':"http://schema.org/Restaurant"})
    for restaurant in restaurants:
        output.append(extract_restaurant_data(restaurant, file_name))
    return output
To create the json file the process loops over the files in the results directory of the webscraper I created. Files that have already been successfully processed are excluded. I was not sure on how long this process would take, if for some reason it crashes it is always nice to be able to continue the data processing from where it stopped working. Data is saved using the JSON Lines format, each line in the file is a new JSON object. This format is supported by Power BI as well as Big Data technologies like Spark. I included a line to print the progress as I like to see in the terminal how far my script is with the processing.
with open('json_file/log_success.txt', 'r+', encoding='utf-8') as f:
    files = [x for x in os.listdir('results') if x not in [x.strip() for x in f.readlines()]]
total = len(files)
progress = 0
for file_name in files:
    try:
        result = extract_html_file(f'results/{file_name}')
        with open('json_file/restaurants.jsonl', 'a+', encoding='utf-8') as f:
            f.writelines(f'{json.dumps(x)}\n' for x in result)
        with open('json_file/log_success.txt', 'a+', encoding='utf-8') as f:
            f.write(f'{file_name}\n')
            progress += 1
        if progress % 20 == 0:
            print(f'Extracting {str(progress)} out of {str(total)}. Remaining: {str(total - progress)}')
    except Exception as e:
        with open('json_file/log_failed.txt', 'a+', encoding='utf-8') as f:
            f.write(f'{file_name} error: {e}\n')

JSON lines format (restaurants.jsonl)
Power BI data model
For the model I kept things fairly simple. I have 4 source files.
restaurants.jsonl containing all Thuisbezorgd data
gem2020.csv contains municipality data (name + key)
pc6-gwb2020.csv contains postal codes and their related municipality
gem_inwoners_2020.csv contains the population of each municipality
The CBS data be found here (gem2020.csv and pc-gwb2020.csv) and here (gem_inwoners_2020.csv).
From restaurants.jsonl I created base_dataset where the JSON is structure is converted into columns. From the base_dataset I created 4 datasets for the model. For the kitchens I expanded the list of kitchens into new rows. Each row in that table contains a restaurantid and a kitchen_name.

Data transformation overview
Primary keys?
It does not matter where you get your dataset from, you will always find data quality issues. I expected restaurantid to be unique. Unfortunately it was not unique when selecting the distinct combination of restaurant_id and name. I checked the data and it looks like these restaurants have been renamed recently. This probably happened during my 7 hour data processing job. On a total of almost 10K unique restaurants it won’t surprise me that 4 of them had some minor edits in a 7 hour time window, especially now with so many new restaurants opening up because of the restrictions on indoor dining.

Data model
After fixing the problem (for now filtering to exclude the 4 duplicate keys, will probably fix it later on if I still enjoy working with this dataset). The restaurant kitchen is stored in a seperate table as a single restaurant can have multiple “kitchens“. From a definition perspective the term kitchen is strange, but it is what was used in the source HTML. Kitchen is a mix of actual cuisines and products. A restaurant can have both “Italian“ and “Italian Pizza“ as a kitchen. But it looks like there is a limitation on the amount of kitchens you can select as a restaurant selling through Thuisbezorgd. That limit seems to be 3. This means restaurants need to pick their kitchens strategically to optimize their chance of being displayed in customer searches. If people want sushi, you don’t need to include “Japanese” as a kitchen. Especially if next to sushi you are also selling poke bowls and snacks. The rest of the data model is straight forward. Restaurant_location is used to resolve the many to many relation that exists between the municipality and the restaurant. municipality_inhabitants was added at a later stage to calculate the per 1000 inhabitants restaurant count.

Conclusion
A lot of sushi restaurants exist in the Netherlands so the situation in Gouda is not unique. Fun fact: both Gouda and Amsterdam have exactly 0.16 sushi restaurants delivering within the municipality per 1000 inhabitants. What also surprised me was the spread of sushi across the entire country. In almost all municipality’s sushi can be ordered. There are very few exceptions and these exceptions are easy to explain as these are usually densely populated. This dataset only covers Thuisbezorgd, local places to order sushi might exist that are not active on Thuisbezorgd. Also a restaurant can sell sushi without listing it as one of their ‘kitchens‘, which in my opinion would be a mistake from a marketing perspective, but still possible.
It would be interesting to see what insights can be found when this dataset is compared with an extract 1 month later. We would know how many reviews each restaurant got in one month time, how many restaurants dissappeared from Thuisbezorgd, how many restaurants joined Thuisbezorgd, etc.
To be continued…